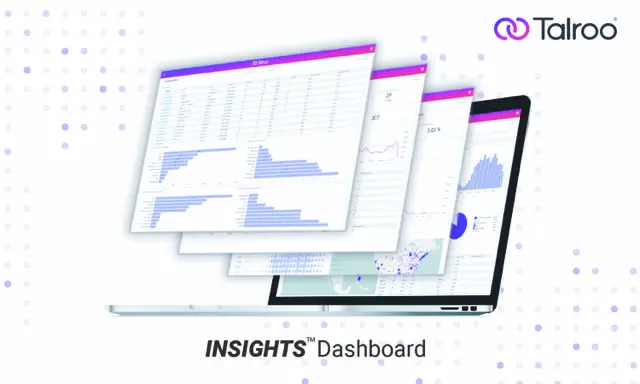
Earlier in the year, Talroo rolled out its new business intelligence tool, Talroo Insights™. We thought we’d highlight the most popular features to make sure that everyone using Insights knows the full capabilities of this robust tool. In addition to the features you’d expect from us, there are a few that you may not – and those can help you plan not just your recruiting campaigns with Talroo, but can help inform your strategy for all your solution providers.
Why Insights?
In today’s low-unemployment environment, competition for talent is at an all-time high. Standing out from your competition can be the difference between getting fully staffed or leaving positions vacant – and losing out on business opportunity because of it. The Insights™ dashboard gives you access to valuable candidate data and market trends that can help you improve talent acquisition strategies, make smarter decisions, and ultimately hire the talent you need to keep your business running smoothly.
Let’s get under the hood.
The Insights platform has four different dashboards. Each one has a different view of data, from campaign performance metrics, to bidding intelligence, to talent supply data, and more. As you go down the navigation, the data gets richer and the dashboards get more interactive. You can export fully-designed dashboards as you see them, or as an excel file to work with the raw data.
Account summary
This is the highest level of data specific to an individual account. Clients can use this to get an overview of key performance metrics across all campaigns. This includes clicks, spends, applications, and more. You can see how these metrics change over time with graphs by date.
Campaign summary
This view looks similar to the account summary, but it can be filtered by campaign or group. We also introduce some new features in this dashboard:
Audience breakdown:
This report enables you to discover all the different audiences that have been matched with your jobs so you can better understand how to best engage and target different types of job seekers.
Job seeker activity:
Discover how job seekers are finding your jobs and how they are interacting with them. What time of day are they searching most? What devices are they using?
Location metrics:
Our heatmap will show you which locations are receiving adequate candidate volume and which ones need more attention. We’ll help you uncover any additional areas you should be advertising in that you may not have thought about.
Job summary
This is where you will find individual job level statistics. All of your standard performance metrics are available down to the job level: clicks, spend, applications, and conversion rate. Here, you can find which jobs are receiving candidate volume and which ones are not – after all, not all jobs perform the same way. We also introduce the average position metric, which is one of the most popular features in Insights. This number shows where your job is seen in search results. If you drill down into each job, you can see the job seeker activity metrics on a per-job basis.
Competitive summary
This is the dashboard that can truly shape your recruiting strategies. It’s packed with useful data, and unlike the previous three dashboards, it opens up market trends and talent supply data that we see across the entire Talroo platform. Where is the talent that you want to reach? What companies are you competing against? Answer these questions and more – and slice the data by industry and location.
Bidding intelligence:
See how your bids stack up to the competition. By taking a data-driven approach, we have removed the unknown factors surrounding bidding and the expected performance. Understanding how to bid appropriately will help you be more efficient with your budget, and to gain exposure without overpaying.
Application intelligence:
See how your cost-per-application and click-to-application rates compare to the competition. If we saw that a competitor has a significantly higher conversion rate, we’d know to examine your application funnel. You might be losing out on potential candidates in your ATS due to a process flaw. This data can alert you to something that may be affecting your entire recruiting effort.
Traffic trends:
Find out what the overall talent supply is for a given industry and location. We include both the searches and click volumes. Learn how much potential is available, and how much you’re currently tapping into. And then we’ll help you tap into what you might be missing.
Job seeker activity:
Like the campaign summary, this shows what job seekers are up to, but on a system-wide level. We open up all of our data to show you who the different audiences are, when they are searching, and where they are located relative to the job location.
Top locations:
Where is the talent supply located? This important data informs where you should be advertising or where you should consider opening a new location.
Top job titles:
What speaks to candidates? Hours? Salary information? We show you the best performing job titles, so you can see characteristics get a job seeker engaged.
if you’re interested in learning even more about what the Insights™ Dashboard can do for you, or to get started hiring better with Talroo, let us know!


